- Home
- Blood Tests
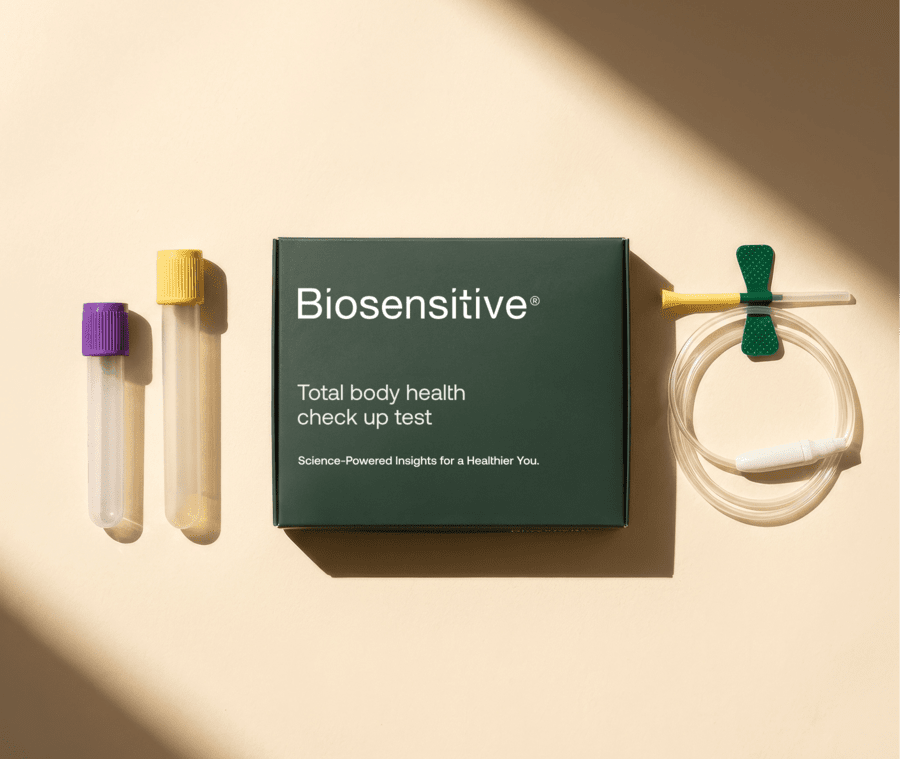
- Total Body Health Check Up Test
 1:1 Professional Clinical Support
Why these Biomarkers matter
Personalised care & guided support
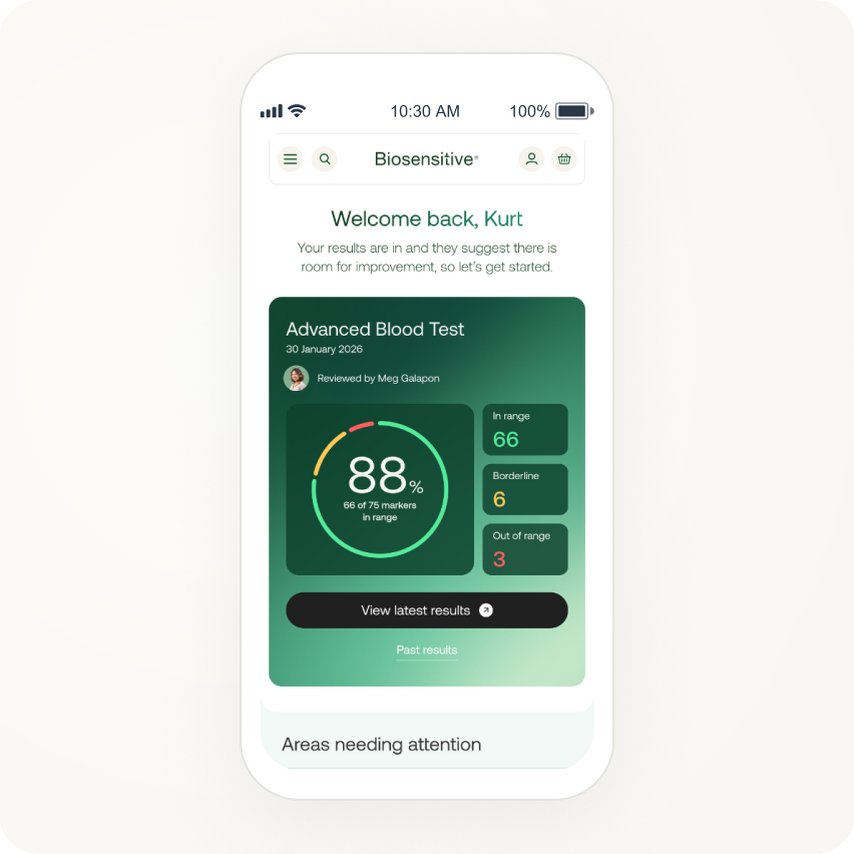
Clear insights & results
Unlock deep health clarity and actionable results with blood testing that transforms complex biomarkers into a personalised roadmap for your wellness.
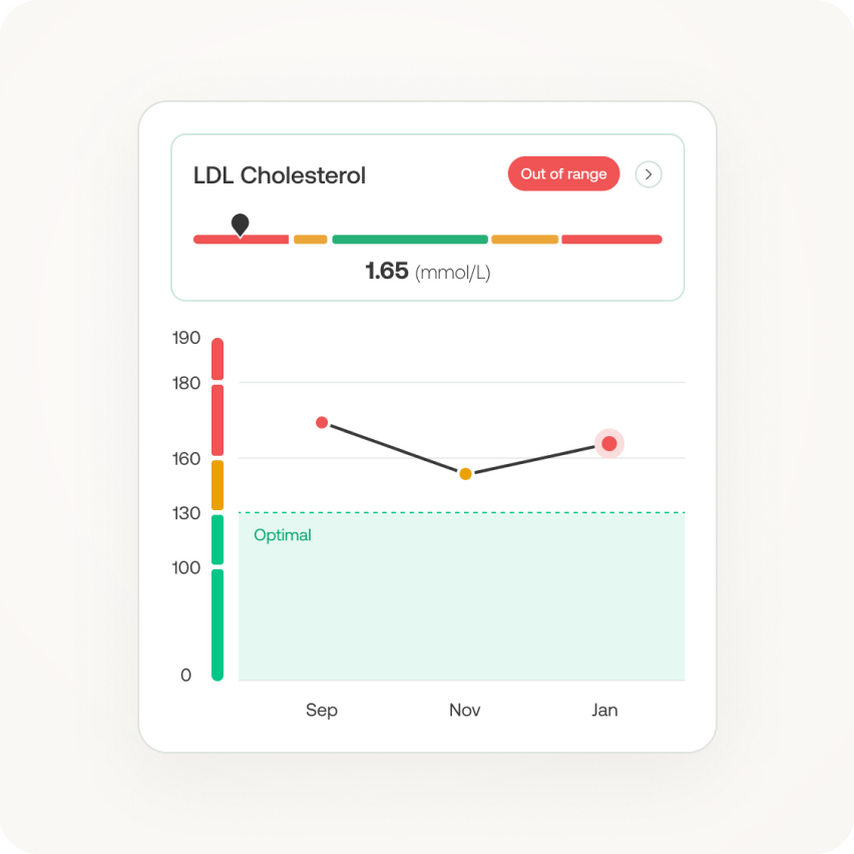
Monitor & track your progress
Stay on top of your health by visualising long-term trends and receiving real-time updates on your biomarkers directly through the app.
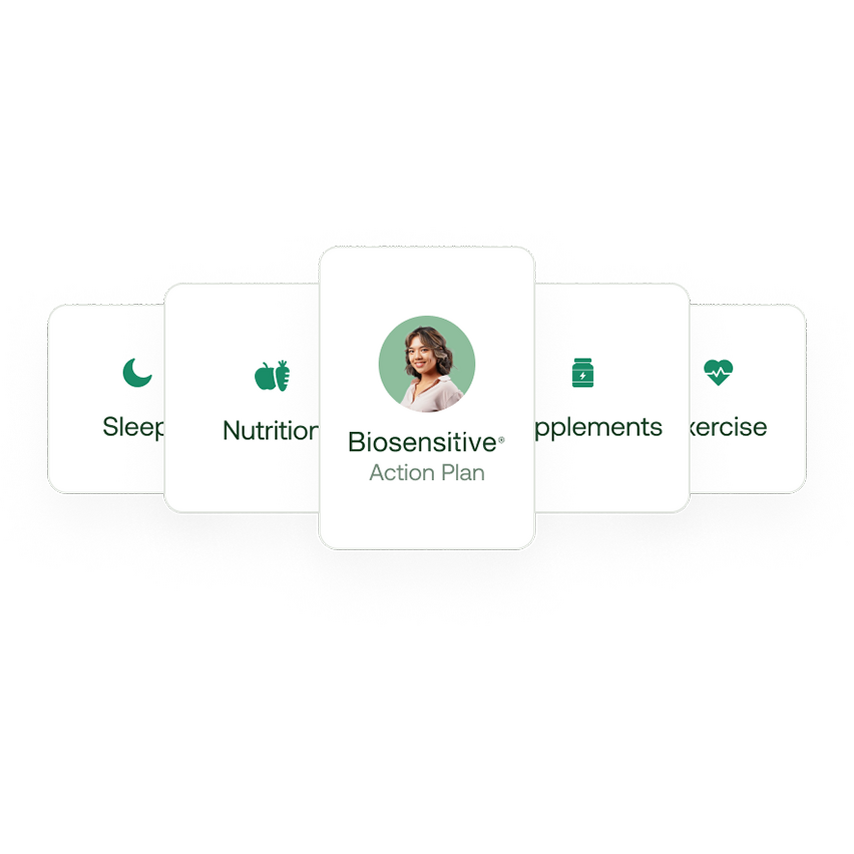
Personalised action plan
Unlock a clearer path to your health goals with a personalised action plan built directly from your unique blood biomarkers.
Transforming lives
"The annual plan has completely transformed the way I approach my health. Having a full overview of my body alongside ongoing support has made a real difference in both how I feel and how I live day to day. I feel more balanced, more in control, and that positive change is reflected in every part of my life. More than anything, I feel like I finally understand what my body needs and how to support it properly for the long term."
Increased energy
Improved hormonal balance
Better Stress Regulation
Body weight
14%
Muscle mass
8%
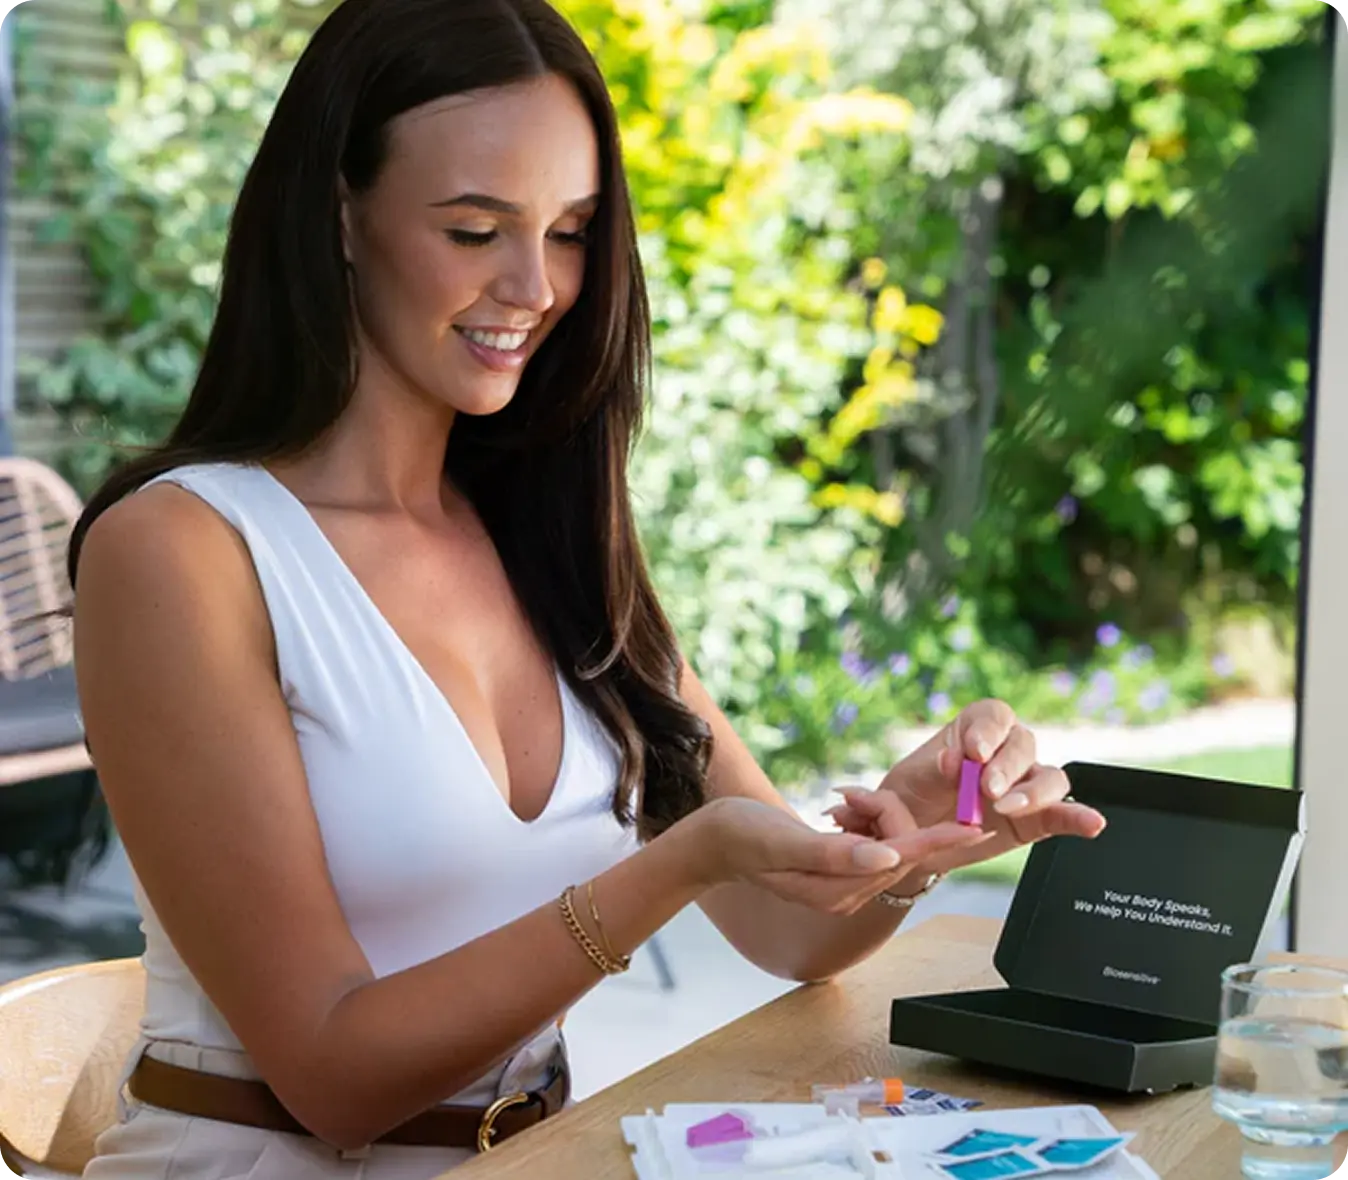

How does it work?
Your step-by-step guide to better health
Unlock deep health clarity and actionable results with blood testing that transforms complex biomarkers into a personalised roadmap for your wellness.
"I found the whole process super easy to do, from taking blood to sending it back, the results have changed my life and relationships"
Annual Blood Test Plan
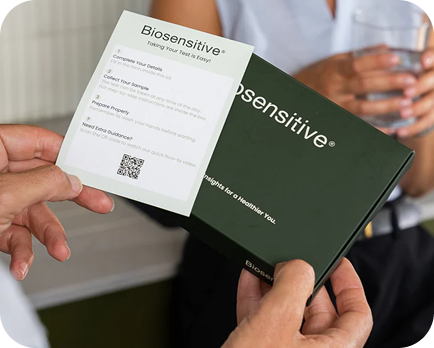
Step 1
Receive your kit in the post
Order your test online and we will have it to you within 48 hours.
Step 2
Take the test at home
We have designed our test kit to be simple and easy to use. Follow our step by step guide included.
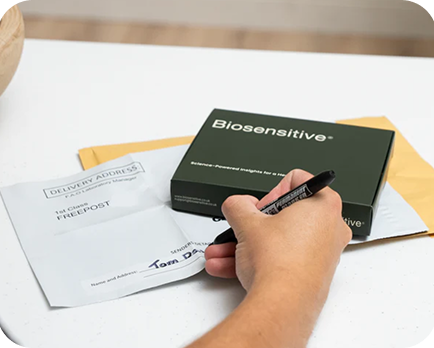
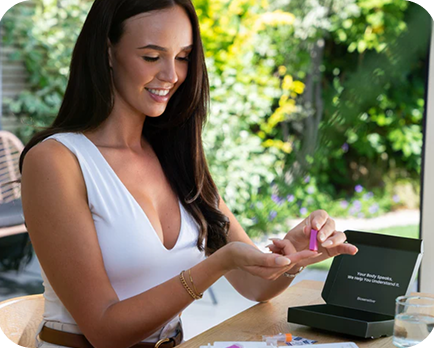
Step 3
Send your sample back
Inside your test kit will be a pre-paid envelope for you to send your kit back to us.

Step 4
Receive your results
You should have your results back within 5 days. Receive a follow up call to guide you through your results.


